Types of Cross-Validation
Depending on the availability and size of the data set, various cross-validation techniques can be used:
- K-fold Cross-Validation
- Stratified K-fold Cross-Validation
- Holdout method
- Leave-one-out Cross-Validation
- Leave-p-out Cross-Validation
- Monte Carlo Cross-Validation
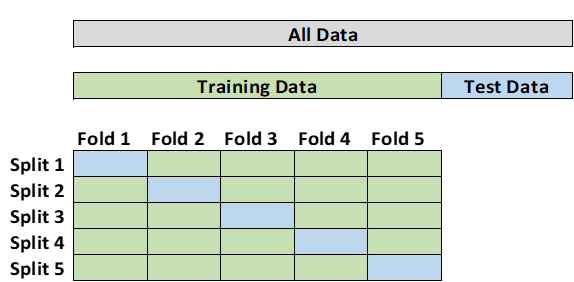
2.1 K-Fold Cross-Validation
In k-fold cross-validation the data is first partitioned into k equally sized segments or folds. K iterations of training and validation are performed such that within each iteration a different fold of the data is used for validation while the remaining k-1 folds are used for training. (Lau, 2020) This method does not work well with small sample sizes. (Baron, 2021) In addition, the data needs to be rearranged in such a way as to ensure each fold is representative of the whole dataset. (Tang, 2008)
2.2 Stratified K-Fold Cross-Validation
The stratified k-fold cross-validation method is another technique that involves the division of data into 'k' subsets or folds. However, to ensure that there is no biased division of data in k folds, the process of stratification is conducted to rearrange the data in such a manner that each fold is representative of the whole data. (Tang, 2008)
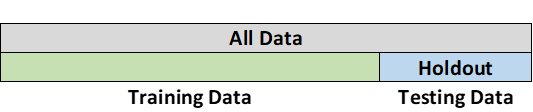
2.3 Holdout Method
The holdout method is the simplest form of cross-validation. For this method, the test data is “held out” and not used during training. With this method, you need to determine what proportion of the data is for training and what proportion is for testing. It is common practice to have 60-80% of the data go towards training the model and the remainder go towards testing the model. Holdout validation avoids the overlap between training data and test data, and therefore gives a more accurate estimate of the performance of the algorithm. (Tang, 2008) The downside is that this procedure is that the results are highly dependent on the choice for the training/test split. (Tang, 2008) According to Baron, although the holdout method is independent of the data and is computationally efficient, small datasets can result in high performance variance. (Baron, 2021)
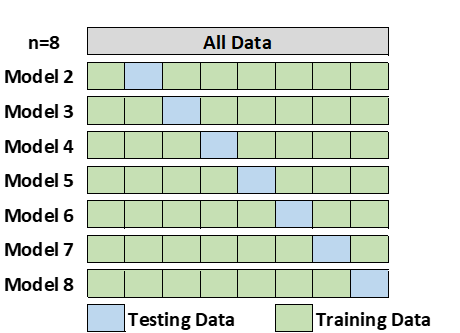
2.4 Leave-One-Out Cross-Validation
Leave-one-out cross-validation (LOOCV) is a special case of k-fold cross-validation where k equals the number of observations in the data. In other words, in each iteration all the data except for a single observation are used for training and the model is tested on that single observation. Computationally, this can be an expensive procedure to perform so it is more widely used on small datasets. (Tang, 2008)
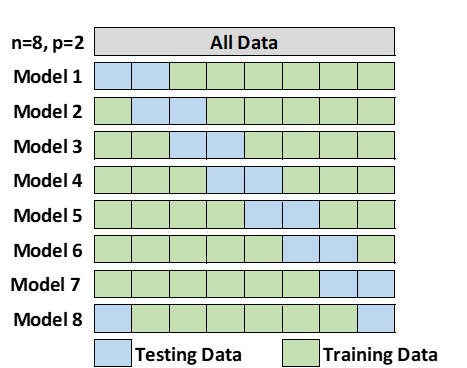
2.5 Leave-P-Out Cross-Validation
Leave-p-out cross-validation (LpOCV) is a method in which p number of data points are taken out from the total number of data samples represented by n. The model is trained on n-p data points and later tested on p data points. The same process is repeated for all possible combinations of p from the original sample. Finally, the results of each iteration are averaged to attain the cross-validation accuracy. (Tang, 2008) Unfortunately, this approach can make the validating process very time consuming in larger data sets. It may also not be random enough to get a true picture of the model’s efficiency. (Baron, 2021)
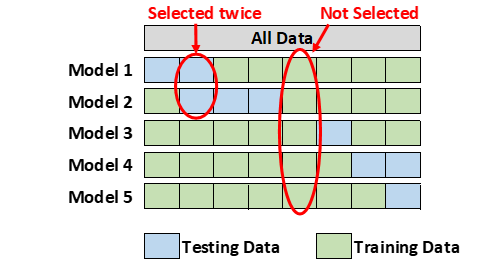
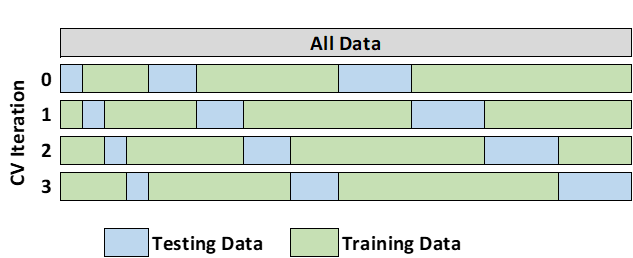
2.6 Monte Carlo Cross-Validation
Monte Carlo cross-validation creates multiple random splits of the data into training and testing sets. For each split, the model is fit to the training data, and predictive accuracy is assessed using the testing data. The results are then averaged over the splits. The disadvantage of this method is that some observations may never be selected in the testing subsample, whereas others may overlap, i.e., be selected more than once. (Lever 2016)